Trading the Market: Methods in Madness

Tuesday, June 30, 2009

Nifty Day Trading - Deadly Temptations - Revisited

Some time ago - almost a month now - I had talked about a dangerous temptation. Based on how I messed up today's trading, I am going to change dangerous temptation to deadly temptation. To understand why, do read on. .....


Ok, to begin with since I was traveling, the first time today I looked at the market was around 1 pm. By that time the market was in clear down trend for the day with spot Nifty around 4330. My first trade was a short sell which unfortunately was stopped out because too tight a stop loss.

And then I misread the market movements because of a preconceived notion and the temptation alluded to above.

Between 1 pm and 2.15 pm, Nifty moved between 4330 and 4310 twice finding support at 4307/4305. Based on Nifty weekly pivot of 4302, I had this preconceived notion that this will be a very strong support. Also at the back of my mind I have been playing the tune that the market has fallen so much, it must find support .

Stupid me.

So despite clear STRONG down trend, I bet on a reversal with Nifty Future rebounding from 4297, I went long at 4323 Nifty Future with stop loss below 4297. And promptly lost 33 Nifty points. Subsequently, I did short and recovered a part of the loss. BUT the psychological damage was more difficult to handle.

I learned two lessons today.

1. When there is a tussle between price action and predetermined levels - follow the price trend.

2. If you follow the path of temptation and predict turnaround, you will be discarded by the market 1 out of 20 times.

In case you want to read about my previous post on dangerous temptation, it can be found here.

If you have any comments please write to me at stockmarket.methods.in.madness@gmail.com

Like this post? You can receive it free by subscribing. Just click on this link


Disclaimer: The above analysis is just that - my analysis. If you choose to trade on the basis of this analysis, you will be solely responsible for the outcome of the trade - profit or loss. Please keep in mind that trading and in particular day trading is not for the novice and there is significant risk of loss of capital in trading.

Sunday, June 28, 2009

Revisiting Nifty Positional Trading Opportunity - 28 Jun 2009

Recently I had advocated or rather identified a situation where I believed there was an opportunity for initiating shorts in Nifty futures for positional traders. The analysis can be seen here and here.

Since then, the market had once broken down below 4200 but found support at 4140. The price action for the last week seems to indicate that nifty has already found a local bottom.

This is the context I would like to reexamine using the same charts that I had used in the previous ones.

Lets look at the daily nifty chart. ( Click on the chart to get a larger view.)


As we can see, the closing price at the end of the week has moved inside the channel between 20 WMA High and Low following the recent upside momentum.

However, the fact that the upper line of the channel - currently at 4452 has not been pierced suggests that there will be a lot of resistance around 4452.


In other words, the possibility - or even a 30-50% probability - exits that Nifty may resume its recent correction.


This case for shorting becomes slightly more persuasive, if we look at the weekly picture next.


In our last analysis, we drew attention to the slow stochastic in the weekly picture.

However, now notice that the slow stochastic is finally coming out of the overbought region after several months there.


This typically results in a sharp sell off and may generate an opportunity for taking long positions at that point for those who might have missed entering the rally earlier.

Does this mean we should short right away? ABSOLUTELY NOT. First of all what is the hurry? Secondly, we must not dismiss the fact that the market did find support at 4140, and in an uptrend right now. The prudent thing would be to watch if the resistance at 4452 or somewhere near - meaning in 4452 to 4700 region - and to short only if that resistance holds. Conservative trader may even wait for 4200/4100 to be broken before shorting.

Summary: Right now the uptrend seems to have resumed. Therefore, no point in shorting. However, the case for shorting may re-emerge if the uptrend reverses at 4452-4700 - we need to wait for price action to confirm the shorting scenario at that point.

If you have any comments please write to me at stockmarket.methods.in.madness@gmail.com

Like this post? You can receive it free by subscribing. Just click on this link


Disclaimer: The above analysis is just that - my analysis. If you choose to trade on the basis of this analysis, you will be solely responsible for the outcome of the trade - profit or loss. Please keep in mind that trading and in particular day trading is not for the novice and there is significant risk of loss of capital in trading.

Nifty Day Trading vs. Investing - What vs. Why

At the outset let me state that I do both - I have a portfolio of investment which I do not touch for day trading. I also day trade Nifty futures. AND I keep these two activities separate.

However, since I am involved in both, I become aware of differences in the approaches and in the types of questions that are asked in each endeavor.

In this post, I will focus on the types of questions that a day trader - hopefully a successful day trader - focuses on.

Short term trading is all about focusing on and analysing the prevailing price action - the shorter the term, the sharper is the focus - and day trading is nothing but price action of the minute, hour or the day.

An investor asks the question: why is the price falling?

A day trader does not ask that question. To her, that the price is falling is a reality.
At the most she might ask:

What has the price fallen to? Or, more importantly,

What was the last swing high? Or,

What are the support or resistance levels, as seen in the price action?


Whereas an investor will ask why is the p/e so high? and might decide to buy or sell based on answers to such questions, a day trader will never ask ( or must never ask ) why the last support broken or why did the last resistance did not hold? Instead, the trader accepts the reality, absorbs a loss if found wrong, and sets up the next trade.

The focus of a trader is what is happening rather that why it is happening.

I would love to hear your thoughts on this topic. If you have any comments please write to me at stockmarket.methods.in.madness@gmail.com

Like this post? You can receive it free by subscribing. Just click on this link


Disclaimer: The above analysis is just that - my analysis. If you choose to trade on the basis of this analysis, you will be solely responsible for the outcome of the trade - profit or loss. Please keep in mind that trading and in particular day trading is not for the novice and there is significant risk of loss of capital in trading.

Friday, June 26, 2009

Nifty Trading - To Trade or Not to Trade - That is the question

One of the most important things to learn in trading - particularly in day trading - is when not to trade.

I feel that for quite an extended period of time yesterday - roughly from 11.30 am to 1.30 pm - it was important to stay away, unless you are extremely good in scratch trades -- meaning you are good in getting in and out of trades - which is not my style.


Lets analyse the situation in a little more detail.

The day started on a positive note, all the 3 min, 13 min, 34 min EMAs were nicely arranged and moving up.

The first danger signal came around 11 - 11.15 am. Nifty failed to move up and cross beyond 4320, below the day's high of 4338. What this meant was that a potential resistance level was established at 4320 by 11.15 am.

And the late/mid morning session continued like that. Just when it appeared Nifty was heading south, it turned back having found support at 4285.

Now, why are we spending so much time on this? Because the chance of over trading is much higher in these situations and over trading typically accumulates many small losses, resulting in a net big loss.

Coming back to the price action, depending on which Moving Average Crossover system you use, chances are that several of them may have given false signals either long or short between 11.15 am and 1.30 pm.

The best way I know of avoiding this is to pay attention to the price action realities and not project which way it was going to go. In other words, accept 4285 and 4320 as support and resistance and wait for them to be broken rather than anticipating a breakdown or a breakout.

And equally important - do not trade between the support and resistance when the range is so short.

The market is cruel to impatient traders and rewards the patient traders. In this regard at least, investors and traders have something in common - they both need to be patient in the context of their respective trading time scales.

If you have any comments please write to me at stockmarket.methods.in.madness@gmail.com

Like this post? You can receive it free by subscribing. Just click on this link


Disclaimer: The above analysis is just that - my analysis. If you choose to trade on the basis of this analysis, you will be solely responsible for the outcome of the trade - profit or loss. Please keep in mind that trading and in particular day trading is not for the novice and there is significant risk of loss of capital in trading.

Wednesday, June 24, 2009

Clouds on the Market Horizon - Unfortunately NOT the Rain Clouds

In the last hour or so, all the news channels including the financial channels and websites have been repeating that the monsoon forecast has been changed from "near normal" to "below normal" - 7% below normal as the report goes.

Now the last two days, we have been living in semi euphoria. On Thursday Nifty successfully dodged a bullet when it broke through 4200 only to reverse from 4140 and we heaved a sigh of relief. Today nifty did not even go anywhere near 4200, instead it went above 4300 briefly; many of us were planning to celebrate short covering tomorrow to propel nifty to 4350 and beyond.

And now comes this piece of uncertainty in one of the most important sector of the economy, Agriculture.

As we all know market does not like uncertainty.

So what can happen tomorrow? One possibility is that the market may shrug of this piece of information and keep moving up as if nothing has happened.

OR,

it may go down big time.

All this analysis is useless if we cannot formulate an actionable plan.

So here are my thoughts for tomorrow 25 July 2009:

I will trade with a negative bias. If Spot Nifty goes below 4260, it will confirm my negative bias and might provide me with a shorting opportunity with SL at Nifty 4310, with targets of 4240, 4220.

Can 4200 break? Now we are deep into speculation territory, but the short answer is NOT impossible!! And if that happens, we will see how the fight takes place at 4140!

Of course, if the market takes off on the upside and Nifty goes above 4352 ( the highest of the week so far) I should think that the market has some communication from the rain gods that we mere mortals are unaware of and I shall respectfully either join the party or stand aside.

If you have any comments please write to me at stockmarket.methods.in.madness@gmail.com

Like this post? You can receive it free by subscribing. Just click on this link


Disclaimer: The above analysis is just that - my analysis. If you choose to trade on the basis of this analysis, you will be solely responsible for the outcome of the trade - profit or loss. Please keep in mind that trading and in particular day trading is not for the novice and there is significant risk of loss of capital in trading.

Support Levels - Universal or Personal?

For sometime now, I have believed 4200 Nifty was an important support level and its breakdown will take the Nifty down much further.

There were others who believed that 4160, 4140, 4100 were the levels to watch for support.

In yesterday's trading, the market frowned on me and smiled on the second group - meaning 4200 broke but the market reversed from around 4140.

This brings us to the important question: which support level should one believe in?

Here is the answer that surprises a lot of new traders. There is no single unique mathematical number that can be calculated by everyone and described as support.

One of my revered mentors, Sudarshan Sukhani, - from whose writings I have learned a lot - has put it beautifully in his blog posting when he says "all said and done, support and resistance levels are personal numbers, used to determine risk. We can have different levels and trade successfully". You can read his posting here.

I would like to add that any support level breakdown is again a probabilistic event - the very fact that it is being called a breakdown means that it is a high probability event , BUT of course once in a while it will be a false breakdown or a breakdown that will see a whipsaw before going down again.

What is therefore important is to develop your own approach to determine support levels and do that consistently - without regard to others levels - this consistency is single most important thing in ensuring that over many trades you will come out with more money ( not necessarily with more number of winning trades) from your winners over your losers.

For myself, I had a bad bad day on Tuesday. On Monday I ended holding a long thinking that 4200 will hold. Of course it did not hold and Tuesday morning first thing I did was to exit that trade and went short at 4180 with SL at 4215. Of course I suffered a loss AGAIN, but then it finally dawned on me that 4160 AND 421O were acting as support and resistance for that part of the day. I successfully used these facts to finally end the day with negative -37 as opposed to -79 the situation I was in after the second trade.

Again for myself, I accept that Nifty has found support at 4140 - accepting that means I will not go short around 4200 any more until that4140 level or even 4100 level is broken. I may choose to go long now or not depending on my reading of the market - remember that for day trading, you have to read the market during the day!!

If you have any comments please write to me at stockmarket.methods.in.madness@gmail.com

Like this post? You can receive it free by subscribing. Just click on this link


Disclaimer: The above analysis is just that - my analysis. If you choose to trade on the basis of this analysis, you will be solely responsible for the outcome of the trade - profit or loss. Please keep in mind that trading and in particular day trading is not for the novice and there is significant risk of loss of capital in trading.

Tuesday, June 23, 2009

Breakdown in Dow Jones - 22 June 2009

Yesterday was a big down day in Nifty - Even though Nifty held above 4200, it did close decisively below 4250. And it seems now it is only a matter of time before 4200 breaks and if it does we will enter a deep correction - this was discussed in previous posts in terms of opportunities for positional trading in nifty and you can read about it here.

Now increasing the probability of 4200 being broken is the price action in the US market and I want to analyse that in this post.

On June 22, Dow Jones Industrial Average (DJIA) had a serious break down. The magnitude of the breakdown can be seen in the 5 days chart.


First it broke through 8500-8475 support and then it went into a tailspin breaking 8400 with elan and then resting a while at 8360 before ending the day at 8339 - a solid 2.35% lower ( equivalent to almost a 100 nifty point drop at today's Nifty).


Fine. But where is it - the DJIA - likely to go in the next couple of weeks?


Lets now look at the 3 months daily chart of DJIA. The picture is not pretty. Looks like 8200 is waiting to be broken, if ( and perhaps when) that goes, next two targets at 8000-7800 and 7400-7200. Not a pretty picture at all. It is therefore safe to sell now and safer to sale after 8200 is broken.

Now, what if there is support at 8200? It is important not to be fooled by that and buy around that. It may just be a resting place. Looking at the chart it seems that only if DJIA closes above 8900-9000, do we have a chance to arrest this downturn. The probability of that happening - I am sticking my neck out here - is quite a bit less than 50-50.

All this increases the chance that Nifty will go down now and stay there for sometime ( a few weeks, if not months and not a few days) - in other words this is likely to be a deep correction in Nifty.

For myself, I had a bad day yesterday; made some mistakes for which I paid yesterday and may pay dearly today also. More of that later. Stay Tuned.

If you have any comments please write to me at stockmarket.methods.in.madness@gmail.com

Like this post? You can receive it free by subscribing. Just click on this link


Disclaimer: The above analysis is just that - my analysis. If you choose to trade on the basis of this analysis, you will be solely responsible for the outcome of the trade - profit or loss. Please keep in mind that trading and in particular day trading is not for the novice and there is significant risk of loss of capital in trading.

Sunday, June 21, 2009

Stock of the Week - Bharti - Revisited 20 Jun 2009

In my previous posting on Bharti in this blog, I mentioned that "Bharti may have entered an intermediate consolidation phase in which it may simply oscillate between 750 and 850."

Subsequent price action in the last two weeks has played out the above scenario. The highest point price Bharti has touched is 866 and the lowest 786. The last five days have seen vary narrow price movements filled with dojis ( meaning the opening and closing prices are almost the same) and inside days.

This shows indecision. And as I mentioned in my post yesterday, "One of the guiding principles (of trading) is when things are not clear - stand aside until the market reveals its hands."

This brings us to a question - what will be the indications that the market has decisively moved as far as Bharti is concerned?

A study of the chart shows that support and resistance of the recent price actions are 870 and 750. Therefore it opens the following trading opportunities.

1. Wait for breakout above 870: Go long if bharti closes above 875-900 for two consecutive days with SL at 750 and target 1000 - 1050.

2. Wait for breakdown below 750: Go short if Bharti closed below 750 for two consecutive days with SL above 850 and targets of 710, 660 and 620.

3. Trade between 750 and 850: In other words, sell at 850 with 875 as SL and 780 as target OR buy at 780 with 750 as SL and 850 as target.

The options 1 and 2 are more conservative than option number 3.

If you have any comments please write to me at stockmarket.methods.in.madness@gmail.com

Like this post? You can receive it free by subscribing. Just click on this link


Disclaimer: The above analysis is just that - my analysis. If you choose to trade on the basis of this analysis, you will be solely responsible for the outcome of the trade - profit or loss. Please keep in mind that trading and in particular day trading is not for the novice and there is significant risk of loss of capital in trading.

Friday, June 19, 2009

Pre-Market Opening Thoughts - 19 Jun 2009

Thoughts on Trading Today - 19 Jun 2009:

The market is at an interesting juncture. The upward momentum has been arrested at Nifty 4700. The market has fallen to its intra day low of 4222 yesterday before closing at 4251.

Is this a correction? Is the correction over? Or is it beginning of a downturn?

No one knows.

And the fun of trading is the joy of decision making in the face of uncertainties, based on some guiding principles.

One of the guiding principles is when things are not clear - stand aside until the market reveals its hands. Since many traders are addicted to trading, they find this difficult to do - standing aside that is.

Ok, if you can't stand aside, what do you do? Since the market has fallen almost 6 days ( with a small +ve Doji in the middle ), an operating assumption can be made that it will take a rest.

Therefore, for DAY TRADERS, it may be OK to trade with a positive bias with SL at yesterday's low which is 4222.

FOR POSITION TRADERS, they need to wait. If the market goes up today then they must wait for a few days to check if the up ward moves halts before reaching 4700. If it does, then that will be the cue that the down ward momentum is resuming. Therefore position traders will need patience or risk taking a trade with a large stop loss.

For Option trader, they can probably do the same as the position trader - that is wait for the cue and then buy a July Put.

Please note that these are indicative strategies - I hope they help you in formulating your own plan of action. I prefer that at this juncture than giving exact entry and exit points for two reasons - 1. the situaion is at a cusp and can go either way, and 2. Trading is an art in which the psychological make up or temperament plays a big role which is why each needs to formulate his/her own detailed strategy.

If you have any comments please write to me at stockmarket.methods.in.madness@gmail.com

 Like this post? You can receive it free by subscribing. Just click on this link


Disclaimer: The above analysis is just that - my analysis. If you choose to trade on the basis of this analysis, you will be solely responsible for the outcome of the trade - profit or loss. Please keep in mind that trading and in particular day trading is not for the novice and there is significant risk of loss of capital in trading.

Thursday, June 18, 2009

Window of Opportunity in Positional Trading in Nifty - Part II

In the last post we asked the question, if Nifty were to drop down from here, what would be the target?

Lets look at the weekly chart for possible answers. Again the 20 day WMA waves are superimposed ( the blue and the red lines).

One operating hypothesis we can make is the weekly wave will not be breached. In other words, notice that the WMA (High,20) red line is at 3874 and still rising. Notice also that the blue line is at 3591. So, we will ASSUME for the time being that Nifty will not breach these. And this gives us a target between 3874 and 3591.

In fact, we can rephrase the analysis to state that those who are waiting to enter the market ( having missed the bus in late March ) can now plan to watch and observe Nifty around these two levels.

Also, the Slow Stochastic has not come out of the overbought zone yet. Presumably, this means we have a few days to catch the down trend.

Please note that we are making an educated forecasting here. We have to keep watching the price action and validate our analysis forecast. If market action roughly supports the analysis then well and good - if price action is completely different we must be prepared to abandon or modify our approach - Market is supreme, not our analysis.


If you have any comments please write to me at stockmarket.methods.in.madness@gmail.com

Disclaimer: The above analysis is just that - my analysis. If you choose to trade on the basis of this analysis, you will be solely responsible for the outcome of the trade - profit or loss. Please keep in mind that trading and in particular day trading is not for the novice and there is significant risk of loss of capital in trading.

Window of Opportunity in Positional Trading in Nifty - I

I posted a short and basic FAQ on Position Trading yesterday. It can be seen here.

Today - before the market opens - let us focus on and analyze Nifty. We will analyze Nifty Cash price movements - of course any trading has to be done in the Nifty Futures ( near term recommended).


Here is the chart of daily movements for the last six months. What we have plotted are 20 day Weighted Moving Average (WMA) of highest prices and 20 days WMA of lowest prices in this time frame. Since lowest price is always less than the highest price on any given day, these two curves do not intersect - instead they form "waves" which are very useful in positional trading.

What do we notice?
First of all, note that yesterday Nifty has closed below the "lowest value" WMA. Notice also, how infrequently the price closes above or below these channels. In fact - here is the second observation - it crossed the channel last when it closed above the "highest value " WMA on March 16th and we all know and can see here in the chart too what happened after that.

So it is possible - and by possible I mean that there is a more than 50-50 probability - that the nifty will drift down from here.

But since this is a game of probability, we must keep Stop Loss. What would be a good place for that? 4700 will be a good place because it is just above the highest level reached in the last week and moreover any break out has to cross that. Also, note that the Stop Loss is a good 350 points away - this is a characteristic of positional trading. Do not take the trade if you are uncomfortable with such a large stop loss and wait for other opportunities, OR, cut your position to suit the large SL amount. ( Please refer to my earlier post on placing Stop Loss - they can be found here and here.)

If we short Nifty here, what is the target?
In the next post we will analyze the same from a bigger picture and that will help us to make an initial guess at the target of this possible down move.


If you have any comments please write to me at stockmarket.methods.in.madness@gmail.com

Disclaimer: The above analysis is just that - my analysis. If you choose to trade on the basis of this analysis, you will be solely responsible for the outcome of the trade - profit or loss. Please keep in mind that trading and in particular day trading is not for the novice and there is significant risk of loss of capital in trading.

Wednesday, June 17, 2009

Positional Trading - A Short FAQ

Positional trading means making a call ( buy or sale ) and staying with that call for several weeks and may be a few months.

Two things are clear from the above definition.

1. Position trading opportunities will come less frequently than day trading ( obviously!) and also less than swing trading ( usually positions held for a few days )

2. The stop loss will be far from the price where the position is taken. Why? Because, you want to hold the position for a longer time frame and hence a tighter stop loss may close the position prematurely.

What is the advantage of position trading? Less stress (probably) but more importantly intra day or intra week volatility impact is less.

What is the disadvantage? Less trading opportunity. Last time a positional trading opportunity came by in Nifty, it was in the week of March 23/ March 30. ( Hint: check your weekly nift\y chart.

I believe another Nifty positional opportunity is around the corner. More on that in the next post.

Technical analysis works ( in a probablistic sense)

Earlier this morning I suggested trading with a negative bias. In fact, part of what I said was

"If the market opens lower, I would wait 4480 to be broken decisively before shorting. Yesterday's high 4540 will be a good SL"

The market broke 4480 early but then went up to 4520 almost. Second time when it broke 4480, it did not look back.

I do not want to say merely that technical analysis work - what is more relevant is to say that if you u use technical analysis AND trade with discipline, then you increase the odds in your favour to buy low and sell high OR sell high and buy low. In this case discipline meant selling below 4480 and keeping SL above 4540!

The day's action has opened the doors for positional traders. I will write about this in my next posting.

If you have any comments please write to me at stockmarket.methods.in.madness@gmail.com

Support and Resistance in Day Trading - View on 17 Jun 2009

I was away for three days - almost three life times in day trading.

After a quick look at the nifty charts over the few days and also keeping in mind the US market action yesterday, here is my trading strategy:

Trade with a negative bias.

In particular, if the market opens slightly higher than 4520 ( say 4550) - make an operating assumption that 4600 will be a significant resistance level. Why 4600 as a resistance level?

Look at the 5D chart which shows that 4600 was a support last Thursday and broke down on Friday. So it is relatively safe to assume 4600 as a good resistance.

With this assumption you can short closer to 4600 ( in the 4560-4580 level) with SL at 4615. If SL is hit, I would refrain from trading short or long and wait to see if there is a new resistance level. Of course for another breakout to happen 4710 has to be crossed.

If the market opens lower, I would wait 4480 to be broken decisively before shorting. Yesterday's high 4540 will be a good SL.

Lots of options. The trick is to pick one strategy. If that works for the day, good. If not, study the market action and try to understand what the message is before putting in a trade!!!

If you have any comments please write to me at stockmarket.methods.in.madness@gmail.com

Disclaimer: The above analysis is just that - my analysis. If you choose to trade on the basis of this analysis, you will be solely responsible for the outcome of the trade - profit or loss. Please keep in mind that trading and in particular day trading is not for the novice and there is significant risk of loss of capital in trading.

Sunday, June 14, 2009

Stock Study of the Week - SBI - 14Jun2009

On weekends I spend sometime studying charts of the reputable companies - those that make up Sensex or Nify or BSE200 - either to detect near term price pattern or to seek dips and pullbacks.

This week I looked at the chart of SBI - certainly a reputable company!


As you can see, the last Friday closing price 1634 is below 1660 which is the 20 EMA ( Low). It seems that we can expect the stock to move down further in the next few weeks. Now this down turn will be arrested or over if if the stock were to close above its 20 EMA ( High) which is 1754 at this time.

In other words, aggressive traders can short SBI with a SL at 1754.

What about an investor who is waiting for a chance to buy SBI at lower price? S/he can also make use of this analysis and wait for a lower price to be reached. What target price should we look for in such a case?

Lets look at the chart again. The 50 day EMA ( Low) is located now at 1475. So we can reasonably set a target of 1475.

In other words, a trader can short SBI now with SL at 1754 and a target of 1475. And an investor wanting to accumulate SBI at a more reasonable valuation can plan to - not hope to - pick up SBI around 1475/1500 which is a good 135 points below the current price.

Does this analysis make sense to you?

If you have any comments please write to me at stockmarket.methods.in.madness@gmail.com

Disclaimer: The above analysis is just that - my analysis. If you choose to trade on the basis of this analysis, you will be solely responsible for the outcome of the trade - profit or loss. Please keep in mind that trading and in particular day trading is not for the novice and there is significant risk of loss of capital in trading.

Friday, June 12, 2009

A Perfect Day for Oscillators

Yesterday, I had mentioned that Nifty 4530 would be an important level. Sometimes the market is nice to you and allows you to be correct. Indeed, today the market pivoted around 4530/4540.


Such days are fantastic for oscillators. Look at the slow stochastic chart. If you bought and sold as the stochastic came out of oversold and overbought regions, you would have made a resonable amount of Nifty points in trading today. I have not checked with other oscillators though.

If you have any comments please write to me at stockmarket.methods.in.madness@gmail.com

Disclaimer: The above analysis is just that - my analysis. If you choose to trade on the basis of this analysis, you will be solely responsible for the outcome of the trade - profit or loss. Please keep in mind that trading and in particular day trading is not for the novice and there is significant risk of loss of capital in trading.

Wednesday, June 10, 2009

Another Breakout, But ......

The market had another breakout today. All seems to be well, except that the advance / decline ratio for all nse stocks actually reversed in the final hour ( meaning it had more declining stocks than advancing ones).

This could be a cause for worry.

One more observation. Nifty future had a double bottom at 4630/4635. The pivot points for Nifty for tomorrow are PP: 4632. Thus 4630 (Nifty) may turn out to be an important level tomorrow. The S1 and R1 are at 4575 and 4712. You can develop a strategy around the 4630 but do keep tight stop loss and do not fight the market, in case your strategy turns out to be out of favour with the market price action.

If you have any comments please write to me at stockmarket.methods.in.madness@gmail.com

Disclaimer: The above analysis is just that - my analysis. If you choose to trade on the basis of this analysis, you will be solely responsible for the outcome of the trade - profit or loss. Please keep in mind that trading and in particular day trading is not for the novice and there is significant risk of loss of capital in trading.

Listening to the Market - 10 Jun 2009

We seem to be at an interesting juncture. While the intermediate up trend is still intact, there is a debate whether Nifty will immediately break out above 4650 or whether it will take rest for some time and head towards a resting place around 4000. 3800 etc.

No one knows.

And yet we must act in some way. This is where your own sense of the market comes in.

Given the fact that we are at a significant resistance, it may be prudent to trade the next few days with a negative bias. Is there a contradiction between saying the intermediate trend is up and trading with a negative bias?

Not really, since we are talking about two different time frames - several weeks to months for the intermediate up trends vs. trading now for the next few days.

For today I will watch the 4520 -4530 Nifty level - this is a level Nifty tested several times yesterday before finally breaking above 4540 and racing towards 4560.

If this level breaks, then Nifty might begin to drift towards 4490 for the day. It might make sense to trade with two lots ( Nifty or Mini nifty ) - close one for quick gain and allow the other to develop. This is if the market is kind to you. If not, the stop loss must be at Nifty 4570.

Conversely, you can use the strength of 4520 support to go long with a SL at 4490 - the choice is yours !!! Today's Pivot points are as follows: PP:4493, S1:4423, R1:4620, S2: 4296, R2:4690.

What would be the biggest mistake that a trader with a negative bias can make? The biggest mistake is to get hooked to the negative bias and not listen to the market if it does race towards 4650 and above. If that were to happen, either stand aside or participate on the long side.

This is what listening to the market means - be right or wrong in your bias but correct yourself when the market proves you wrong.

If you have any comments please write to me at stockmarket.methods.in.madness@gmail.com

Disclaimer: The above analysis is just that - my analysis. If you choose to trade on the basis of this analysis, you will be solely responsible for the outcome of the trade - profit or loss. Please keep in mind that trading and in particular day trading is not for the novice and there is significant risk of loss of capital in trading.

Tuesday, June 9, 2009

Are you over trading?

Over trading is often mentioned as one of major mistakes in day trading.

Now I ask the question what is over trading in day trading context.

First of all I follow essentially a trend following system. Which means I must detect a trend before I trade.

Going over many days of nifty daily 5 min charts, I notice a pattern that most major trends last about an hour or an hour and a half. Sometimes a trend lasts through out the day.

Therefore, it would seem that on most days, I could aim to catch may be one major trend. This would mean one trade per day. If I allow for missed or misinterpreted trends, may be I should add 2-3 more trades.

Which means that I should not be placing more than 3-4 clean trades on any given day. I checked my trading record and discovered that typically any day I have traded more than 6 times I ended up losing money.

There you go, if you are putting more than 3/4/5 trades daily, you are probably guilty of over trading and are probably paying for it too.

If you have any comments please write to me at stockmarket.methods.in.madness@gmail.com

Coping with Loss - What a Trader must not do

The last two days were quite amazing. First, over 100 points drop and then next day ( today) a V shaped recovery starting almost in the morning itself.

It is possible that some of us - especially the new ones - had difficulty coping with yo yo days, and may have incurred losses.

Losing money is never pleasant, particularly so if it was a trending day and you know it should have been a money making day. Such losses play havoc at the back of your mind.

Here are a few things you must guard against while you go back to trade the next day.

1. Forget about the loss - In particular do not try to trade trying to recover the lost money. (Remember that neither the market nor other traders have any idea of your loss and they simply do not care!)

2. In stead of focusing on recovering from the loss, focus on the trading methods and plans relevant for the day - where are the support and resistance? how big are the fluctuations, etc. In other words, focus on trading right as opposed to trading the of having lost money.

Steenbarger has written beautifully on this topic. You can read these here and here.

If you have any comments please write to me at stockmarket.methods.in.madness@gmail.com

In confusing times, look at the bigger picture

This piece of wisdom works in trading as well !!

By a bigger picture in trading, I mean go to a bigger time frame. For example, look at the weekly Nifty chart.

As you can see, yesterday nifty already went below the low of the previous week.

Now, the low of the week previous to that is 4092 and the close was 4449. Nifty has already broken through 4449, but now we can make the working hypothesis that 4092 will hold.

The 5 Week EMA is at 4269. This could also provide strong support.

With these inputs, let us form a strategy to play it on the long side. Suppose your money management allows you to take a risk of 60 nifty points, then you can wait to buy nifty at 4329 with a stop loss at 4269 ( the 5 week EMA ). In other words you wait till Nifty falls further - of course there is no telling if it will fall to 4329, but if it does, you can execute the above long strategy.

What if Nifty comes down to 4340 and rebounds to 4370. Well, if you are really disciplined then you would say that is fine, the market did not reward me this time, may be some other time. Of course the other approach is to re-evaluate your strategy - but it is better to not shift strategies too frequently.

If you have any comments please write to me at stockmarket.methods.in.madness@gmail.com


Disclaimer: The above analysis is just that - my analysis. If you choose to trade on the basis of this analysis, you will be solely responsible for the outcome of the trade - profit or loss. Please keep in mind that trading and in particular day trading is not for the novice and there is significant risk of loss of capital in trading.

Monday, June 8, 2009

How to trade after today's big drop in nifty

Given the big drop today, it seems that the downward momentum will not be immediately reversed. Therefore, it might make sense to trade with a negative bias.

What does trading with a negative bias mean? It certainly does not mean to short the market first thing tomorrow morning. For one thing, the stochastic on 15 min, 30 min and 60 minute charts are all quite oversold suggesting that there might be a pull back rally tomorrow morning.

Trading with a negative bias means 1) realizing that odds for profitable tread are more with short trades than long trades AND 2) waiting for a set up for placing a short trade.

One approach for waiting for the short set up could be to look at the slow stochastic on 4 minutes yahoo chart. Today at the end of the days trading the stochastic is in oversold region. Wait for it to move up and approach or get into the overbought area. And then as it comes out of the over bought area place a short trade, Notice that the set up makes several assumptions. If these assumptions do not materialize then the set up will not be complete and naturally the trade will not be taken. At this point the stop loss for such a trade would seem to be above 4540.

You can look up at the slow stochastic on 4 minute charts by clicking here or here.

Weekly Chart for Nifty - What a Year and half!

I love charts. I mean as some one who has been trained as a scientist, I love looking at the same thing from different perspectives to get a comprehensive and deep understanding.

For stock markets and nifty, charts allow me to do the same; and you can look at 5 minute charts, 30 minute charts, EOD charts, weekly charts - each representation gives you a fresh glimpse at what has been the unfolding story and what are the patterns in madness.

So, here is my source of joy this morning. Almost accidentally bumped into the 18 months weekly chart of Nifty ( you can click on it and get a larger view in a new window ).


Fist of all, there is a 2/20 EMA breakout system due to David Landry, according to which two consecutive close above the 20 EMA is a buy signal and two consecutive closes below 20EMA is a sell signal.

Applying it to the chart, you can see that first sell signal came in mid Jan 2008 ( no surprises here !!!). But and here is the good news, even if you missed selling there, you got at least two more selling signals - one in early May another in early September - thanks to the slow stochastic indicating overbought in a strongly down trending market.

So much for the past missed or grabbed opportunities. What about the future? Well, the same Landry system has given a break out in early May. But even if you have missed that one, do not worry. Keep a watch out for the slow stochastic, which by the way has been in the "overbought"
region for many weeks now and that indicates strength. But keep an eye on it. Sooner or later, it will have a dip and be in the oversold region. Since we are in a a strongly up trending market, that may be a great time to get in!!!

So dear reader here I am signing off wishing you a lot of patience and many happy readings of the charts.

P.S. By the way, you can read about the 2-20 EMA breakout system here.

Disclaimer: The above analysis is just that - my analysis. If you choose to trade on the basis of this analysis, you will be solely responsible for the outcome of the trade - profit or loss. Please keep in mind that trading and in particular day trading is not for the novice and there is significant risk of loss of capital in trading.

Sunday, June 7, 2009

Moving the Stop Loss

In a post a few day's ago entitled Probability and the Art of placing Stop Loss , we discussed some subtle aspects of placing and moving stop loss. One of the points mentioned is the importance of not placing a stop loss too close.

Coincidentally, Brett Steenbarger in his blog dated 6 June talks about a similar aspect of stop loss - that of not moving it too often. He says and I quote

"I generally will move a stop only once: when a trade has traveled roughly halfway to its intended target, I will move the stop to breakeven. In other words, if the market is validating my idea, I don't want to overstay my welcome to the point where a winning trade turns into a losing one. Nor, however, do I want to move the stop prematurely and exit a trade because of normal, expectable noise that would precede a move to my target. Knowing where my target is (based upon identified support/resistance, edges of ranges, pivot points, etc.) is key to knowing where to place my stop: I always want more reward in the trade than risk"

You can read his complete post here.

Saturday, June 6, 2009

Bharti - Revisited - 06 Jun 2009

In an earlier post almost a week ago, I suggested for aggressive traders to buy Bharti between 750 and 820 with a stop loss at 720, and for conservative traders to buy above 875.

One more week has passed. From the chart at the left, it appears that while the uptrend is still intact, the upward momentum has stalled somewhat. And Bharti may have entered an intermediate consolidation phase in which it may simply oscillate between 750 and 850.

At this point, I do not recommend adding any long position in Bharti. It is far better to wait for Bharti to come out of the consolidation phase before taking a position.

For long positions already held, the choice is to either hold the position with a revised Stop Loss of 750, or to liquidate the position and get into cash. Individuals can make their own decision, depending on their own overall cash position etc.

The uptrend in Bharti will be confirmed if Bharti closes on a daily basis above 875, Conservative traders can take long position at that point.

If on the other hand, Bharti closes below 750 on two consecutive days, it is likely to enter a near teem downtrend. In such a scenario, aggressive traders can sell Bharti below 750 with a Stop Loss above 815 for likely targets of 710, 660 and 620.

Disclaimer: The above analysis is just that - my analysis. If you choose to trade on the basis of this analysis, you will be solely responsible for the outcome of the trade - profit or loss. Please keep in mind that day trading is not for the novice and there is significant risk of loss of capital in trading.

Friday, June 5, 2009

Probability and the Art of placing Stop Loss

As I trade more and more I realize that I have difficulty in selecting the right stop loss level.

At first glance, the technical determination of a stop loss level seems to be rather straightforward. If you are going long, then the stop loss should be the last swing low or even the previous swing low. The difficulty of the situation is that sometimes the stop loss is so far away that it is scary to think of the possible loss.

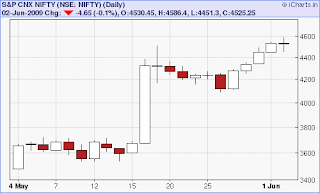
Take for example the Nifty chart on the left. If you happen to go long between May 19 and 22, your stop loss should have been at 3675 and that is a good 600 points below!!

The important thing to realize is that not only you need to consider the amount of loss but also the probability of the loss being realized.

In other words, if the stop loss is set 50 points away and the probability of its getting hit is 10%, that may be better than setting a stop loss 10 points away where the probability of getting hit is 60% [[This is because 50 x 0.1 < 10 x.06]]. This means that all other things being roughly equal, a wider well thought out stop loss may work better in the long run.

This point is particularly relevant for day trading, A tight trailing stop loss may actually result in getting stopped out more often than what you anticipate ( this is precisely what is meant by high probability of the stop loss getting hit), resulting in large number of mini losses, all adding up to a big total.

Thursday, June 4, 2009

Analyzing actual Trades - 04 Jun 2009

This morning, I said

Quote

For Traders with a SHORT TERM BEARISH VIEW OF THE MARKET

Go short if Nifty trades below 4470, SL at 4530 or 4575 depending on your risk appetite and position sizing


For Traders with a SHORT TERM BULLISH VIEW OF THE MARKET

Go long around 4490 ( nifty ) with SL 4430. If 4430 breaks, stay away until a dip is clearly visible

Unquote


As it turned out, the first group of traders would have perhaps broken even with a bit of tight management of SL , while the second group would have made a good amount of money.

For myself, I chose to trade with a negative bias, and was a bit more aggressive than I had suggested. Also, for me preservation of capital is of great importance. Hence I try to break even as soon as possible. Here were my actual trades from today.


First Trade:

Time: 10.08 am: Sell Short at 4494.25, Initial ( Mental ) Stop Loss @ 4540
Time: 10.24 am: Nifty at 4484, placed Actual Stop Loss @4512
Time: 10.39 am: Nifty at 4472, moved Stop Loss to 4591 (BREAK EVEN after commission, YES!)
Time: 11.00 am: SL triggered.
No gain no Loss on this trade.

Second Trade: ( still staying with Negative bias )

Time: 11.14 am: Sell Short at 4487 Initial (Mental) Stop Loss @4512
Time: 11.17 am: Nifty at 4493, placed Actual Stop Loss at 4504
Time: 11.27 am: Nifty at 4475, moved Stop Loss to 4485 ( In the Positive , YES!)
Time: 11.36 am: Nifty at 4463, moved Stop Loss to 4474
Time: 11.45 am: Nifty at 4457, REALIZED STRONG RESISTANCE at 4450, moved Stop Loss to 4563
Time: 11.47 am: Stop Loss triggered
Net Gain - 20 points after commission

What happened during the rest of the day? Watched the market recover ground, realized my negative bias is not supported by price action, chose not to participate.

What is the moral? If you have a reasonable strategy, and you stick to it, you have a reasonable chance of getting somewhere even if you misread the market.

Disclaimer: The above analysis is just that - my analysis. If you choose to trade on the basis of this analysis, you will be solely responsible for the outcome of the trade - profit or loss. Please keep in mind that day trading is not for the novice and there is significant risk of loss of capital in trading.

Pre-Market Opening thoughts - 04 Jun 2009

It is now 9.50 am. India Time

SGX Nifty bid / ask are 4490/4495.

For short term trading, this is a key level.

For Traders with a SHORT TERM BEARISH VIEW OF THE MARKET

Go short if Nifty trades below 4470, SL at 4530 or 4575 depending on your risk appetite and position sizing


For Traders with a SHORT TERM BULLISH VIEW OF THE MARKET

Go long around 4490 ( nifty ) with SL 4430. If 4430 breaks, stay away until a dip is clearly visible.


Disclaimer: The above analysis is just that - my analysis. If you choose to trade on the basis of this analysis, you will be solely responsible for the outcome of the trade - profit or loss. Please keep in mind that day trading is not for the novice and there is significant risk of loss of capital in trading.
Examination of Today's Nifty - 03 Jun 2009

As a part of preparation for a day's trading, I always review the previous days price action. To me, previous day's chart contains a huge wealth of information.

Here is the chart for 03 June ( you can click on it for a larger view).

To begin with, notice the double top during the day at approximately 4575 reached at around 11 am and 12.30 am.This means that at least for today, there were more sellers than buyers at 4575.

The day's low was at 4480 which came at around 1.45 pm followed by some recovery. This means that there were more buyers than sellers at 4480.

The level 4480-4490 is turning out to be a battle grounds for buyers and sellers. Day before yesterday Nifty went below 4490 and bounced back from 4450.

Finally, the day ended almost flat. This makes it two consecutive days of range bound movements for Nifty between 4575 and 4450. Such a narrow range cannot last too long. Sooner or later, Nifty has to break through these levels.

Another very important thing to note is the 20, 50, 100 EMAs have almost converged. This is a situation that is poised for a break out. Whichever way Nifty breaks out, we will need to take positions in that direction.


However, it does appear that market may need a breather at this point. For tomorrow's trading, it might be a good idea to trade with negative bias and go short with 4585 level as Stop Loss. If the market does break out on the higher side, I will either step aside or go long with a Stop Loss at 4520.

Disclaimer: The above analysis is just that - my analysis. If you choose to trade on the basis of this analysis, you will be solely responsible for the outcome of the trade - profit or loss. Please keep in mind that day trading is not for the novice and there is significant risk of loss of capital in trading.

Wednesday, June 3, 2009

How to identify a dip or a pullback?

Continuing with yesterday's topic, we need to understand the relevance of trading time scale in discussing dips.

For example, today 3rd Jun 2009, the nifty "dipped" to 4480. This is clearly an intraday dip relevant for day trading but may not be relevant for swing traders or positional traders.

A sudden fall is not a dip. It may be just one leg of consecutive falls. For a sequence of falls to become a dip, it is necessary that the price action starts heading back up. If you are a swing trader trading using EOD price indicators, then a good, working definition of a dip could well be a day which has higher prices for two days before AND two days after. This means if you use this definition of a dip, you cannot detect a dip right at its lowest point. You have to wait for two more days.

There is nothing sacred about the number two. You can have three or five in place of two. Of course the number of days you have before and after will also determine by much you miss the bottom of the dip. In my experience, 2, 3 days work well.

Another way to detect a dip and a pull back would be to use plots of Highs and Lows of the moving averages. If you plot Highs and Lows of 5 days exponential moving average for the last six months, you can see that there are wave patterns which allows you to identify a dip soon after it happens. This is the basic idea. You can choose another time frame to suit your own needs. But once you choose a time frame, stick to it.

Lastly, you must decide on stop loss and when to take profits. We will cover these in later posts.


Disclaimer: The above analysis is just that - my analysis. If you choose to trade on the basis of this analysis, you will be solely responsible for the outcome of the trade - profit or loss. Please keep in mind that day trading is not for the novice and there is significant risk of loss of capital in trading.

Tuesday, June 2, 2009

Traders must buy of dips... What is a dip?

This is a very important question. No doubt that traders must buy on dips since the trend is up. But how do we know when the dip happens, and what should be the stop loss?

I leave the reader with this important question and with a hint: Whether it is a dip or not will depend on the time frame of your trading strategy.


Look at the one month chart for Nifty. There seems to be a dip in May 26. should you have bought then and what should be the stop loss?

I shall share my thoughts on this in my next posting.

Forecast for June 2 came through

In yesterday's post, I had suggested to go short if nifty fell below 4490:

"Wherever it opens, if it trades below 4490, we can short there with SL at 4535, and target 4450."

I am fortunate that the market obliged and at least part of the market action went that way.

I do not mean to suggest that I have a magic formula which will ensure correctness of my forecast all the time - I will be lucky if I get it right 35-40% and the time. The other times I am wrong, I must manage the stop loss in such a way that my overall profit ( 35% of the time ) is more than the losses for the rest of the trades ( 65% of the time).

That is the name of the game - the game of probability - and these are the methods in seeming market madness.

I do not have a forecast for tomorrow as I am not well today. Wish you the best in tomorrow's trading.

Disclaimer: The above analysis is just that - my analysis. If you choose to trade on the basis of this analysis, you will be solely responsible for the outcome of the trade - profit or loss. Please keep in mind that day trading is not for the novice and there is significant risk of loss of capital in trading.

Monday, June 1, 2009

An Examination of Today's Nifty - 01 June 2009

Before we discuss today's nifty price movements, let us start with a very important topic, namely, relevance of the opening price in day's trading.

Here I can do no better than quoting from Brett Steenbarger's recent blog post on 21 May 2009. Here is the opening paragraph:

"
The opening price .... represents the market's first attempt at locating value on the day. A trending market will stay above or below the opening price for the majority of the session, as we reject that early estimate and probe value higher or lower. A bracketing or range market will tend to accept the early estimate of value, and we will oscillate around the open and/or the day's volume-weighted average price for much of the session.
"

Coming back to today's trade, it opened higher and within half an hour raced towards 4545 which it reached at 10.22 am. Now the index had gone up so much in the last two days, so the question was, is it going to be another tear away day, or will it be range bound and will the market accept the market opening as a fair value?

Such questions can only be resolved by waiting for the day to unfold. As it happened, by 11 am it was obvious that 4545 was the day's tentative high and the market was falling from there. The prudent thing to do was to wait again and see if yesterday's closing held. It did. It reached 4476 at 11.22 and began to turn up.

Thus by 11.30 am, the market had established the day's high at 4545 and day's low at 4476. And the chance increased that it was going to be a range bound day.


Notice also that the market established another support level around 4495 which it visited thrice during the course of the day. By this time, it was a relatively safer bet to put in a long trade around Nifty 4500 with SL at 4476. In other words, we could treat 4500 as a support level with 4476 as the "get me out of here" kind of SL level got long trades.

One can argue that hindsight is 50-50 and it is easy to analyse these at the end of the day rather than during the day. That is true. However, it is only by analysing such price actions can we develop our own approaches to identifying support resistance levels in future trading days.

The other interesting point is that this whole analysis is solely dependent on the day's price action, no fancy indicators needed, only requirements are patience and interest in listening to the message of the market for that day.

What about tomorrow?

Well, again watch out for the opening price and look at the price action to gauge whether the market is accepting the opening price as the fair value or not.

Wherever it opens, if it moves above 4555 and continues to stay above 4555, we can go long with initial SL at 4500. Use trailing SL to protect gains.

Wherever it opens, if it trades below 4490, we can short there with SL at 4535, and target 4450.

The price in the range of 4550 and 4490 is a kind of oscillating zone. I shall try to resist temptation to trade while the price is in this range.

We will know by the end of tomorrow how things pan out, won't we?


Disclaimer:
The above analysis is just that - my analysis. If you choose to trade on the basis of this analysis, you will be solely responsible for the outcome of the trade - profit or loss. Please keep in mind that day trading is not for the novice and there is significant risk of loss of capital in trading.