Trading the Market: Methods in Madness
Showing posts with label nifty. Show all posts

Friday, July 3, 2009

Breakdown in Dow Jones - Revisited - 03 July 2009

I am writing this at 12.30 am Indian time. About 3 pm NY time which means NYSE will close in another hour. But since I cannot stay awake that long, hence writing this blog now.

The Dow Jones has taken a severe beating today until now - to put it mildly.

It is down 178 points or 2.12% and tottering at 8326.

A head and shoulder formation is likely taking shape, BUT for confirmation, we will have to wait for the breakdown below 8200 which is the neck line.

I leave it to the reader to contemplate the implications of this for Indian market. True, India is somewhat insulated but with a global economy still reeling ( though not slipping down an abyss anymore perhaps), I will be concerned about the US stock market potentially heading down.

Actually, I did write on 22 Jun about a scenario of Dow heading south in my blog Breakdown in Dow Jones - 22 June 2009, worried as I was about the ferocity of that fall. I am worried in the same way today after today's fall in Dow Jones.

Perhaps, Dow will find support at 8200, perhaps Nifty will not fall even if Dow goes down to 7800, but it does pay to keep this scenario in mind and take some basic precaution (such as buying a July 3800 put).

If you have any comments please write to me at stockmarket.methods.in.madness@gmail.com

Like this post? You can receive it free by subscribing. Just click on this link


Disclaimer: The above analysis is just that - my analysis. If you choose to trade on the basis of this analysis, you will be solely responsible for the outcome of the trade - profit or loss. Please keep in mind that trading and in particular day trading is not for the novice and there is significant risk of loss of capital in trading.

Wednesday, June 10, 2009

Another Breakout, But ......

The market had another breakout today. All seems to be well, except that the advance / decline ratio for all nse stocks actually reversed in the final hour ( meaning it had more declining stocks than advancing ones).

This could be a cause for worry.

One more observation. Nifty future had a double bottom at 4630/4635. The pivot points for Nifty for tomorrow are PP: 4632. Thus 4630 (Nifty) may turn out to be an important level tomorrow. The S1 and R1 are at 4575 and 4712. You can develop a strategy around the 4630 but do keep tight stop loss and do not fight the market, in case your strategy turns out to be out of favour with the market price action.

If you have any comments please write to me at stockmarket.methods.in.madness@gmail.com

Disclaimer: The above analysis is just that - my analysis. If you choose to trade on the basis of this analysis, you will be solely responsible for the outcome of the trade - profit or loss. Please keep in mind that trading and in particular day trading is not for the novice and there is significant risk of loss of capital in trading.

Listening to the Market - 10 Jun 2009

We seem to be at an interesting juncture. While the intermediate up trend is still intact, there is a debate whether Nifty will immediately break out above 4650 or whether it will take rest for some time and head towards a resting place around 4000. 3800 etc.

No one knows.

And yet we must act in some way. This is where your own sense of the market comes in.

Given the fact that we are at a significant resistance, it may be prudent to trade the next few days with a negative bias. Is there a contradiction between saying the intermediate trend is up and trading with a negative bias?

Not really, since we are talking about two different time frames - several weeks to months for the intermediate up trends vs. trading now for the next few days.

For today I will watch the 4520 -4530 Nifty level - this is a level Nifty tested several times yesterday before finally breaking above 4540 and racing towards 4560.

If this level breaks, then Nifty might begin to drift towards 4490 for the day. It might make sense to trade with two lots ( Nifty or Mini nifty ) - close one for quick gain and allow the other to develop. This is if the market is kind to you. If not, the stop loss must be at Nifty 4570.

Conversely, you can use the strength of 4520 support to go long with a SL at 4490 - the choice is yours !!! Today's Pivot points are as follows: PP:4493, S1:4423, R1:4620, S2: 4296, R2:4690.

What would be the biggest mistake that a trader with a negative bias can make? The biggest mistake is to get hooked to the negative bias and not listen to the market if it does race towards 4650 and above. If that were to happen, either stand aside or participate on the long side.

This is what listening to the market means - be right or wrong in your bias but correct yourself when the market proves you wrong.

If you have any comments please write to me at stockmarket.methods.in.madness@gmail.com

Disclaimer: The above analysis is just that - my analysis. If you choose to trade on the basis of this analysis, you will be solely responsible for the outcome of the trade - profit or loss. Please keep in mind that trading and in particular day trading is not for the novice and there is significant risk of loss of capital in trading.

Tuesday, June 2, 2009

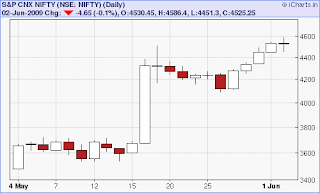
Traders must buy of dips... What is a dip?

This is a very important question. No doubt that traders must buy on dips since the trend is up. But how do we know when the dip happens, and what should be the stop loss?

I leave the reader with this important question and with a hint: Whether it is a dip or not will depend on the time frame of your trading strategy.


Look at the one month chart for Nifty. There seems to be a dip in May 26. should you have bought then and what should be the stop loss?

I shall share my thoughts on this in my next posting.

Forecast for June 2 came through

In yesterday's post, I had suggested to go short if nifty fell below 4490:

"Wherever it opens, if it trades below 4490, we can short there with SL at 4535, and target 4450."

I am fortunate that the market obliged and at least part of the market action went that way.

I do not mean to suggest that I have a magic formula which will ensure correctness of my forecast all the time - I will be lucky if I get it right 35-40% and the time. The other times I am wrong, I must manage the stop loss in such a way that my overall profit ( 35% of the time ) is more than the losses for the rest of the trades ( 65% of the time).

That is the name of the game - the game of probability - and these are the methods in seeming market madness.

I do not have a forecast for tomorrow as I am not well today. Wish you the best in tomorrow's trading.

Disclaimer: The above analysis is just that - my analysis. If you choose to trade on the basis of this analysis, you will be solely responsible for the outcome of the trade - profit or loss. Please keep in mind that day trading is not for the novice and there is significant risk of loss of capital in trading.

Monday, June 1, 2009

An Examination of Today's Nifty - 01 June 2009

Before we discuss today's nifty price movements, let us start with a very important topic, namely, relevance of the opening price in day's trading.

Here I can do no better than quoting from Brett Steenbarger's recent blog post on 21 May 2009. Here is the opening paragraph:

"
The opening price .... represents the market's first attempt at locating value on the day. A trending market will stay above or below the opening price for the majority of the session, as we reject that early estimate and probe value higher or lower. A bracketing or range market will tend to accept the early estimate of value, and we will oscillate around the open and/or the day's volume-weighted average price for much of the session.
"

Coming back to today's trade, it opened higher and within half an hour raced towards 4545 which it reached at 10.22 am. Now the index had gone up so much in the last two days, so the question was, is it going to be another tear away day, or will it be range bound and will the market accept the market opening as a fair value?

Such questions can only be resolved by waiting for the day to unfold. As it happened, by 11 am it was obvious that 4545 was the day's tentative high and the market was falling from there. The prudent thing to do was to wait again and see if yesterday's closing held. It did. It reached 4476 at 11.22 and began to turn up.

Thus by 11.30 am, the market had established the day's high at 4545 and day's low at 4476. And the chance increased that it was going to be a range bound day.


Notice also that the market established another support level around 4495 which it visited thrice during the course of the day. By this time, it was a relatively safer bet to put in a long trade around Nifty 4500 with SL at 4476. In other words, we could treat 4500 as a support level with 4476 as the "get me out of here" kind of SL level got long trades.

One can argue that hindsight is 50-50 and it is easy to analyse these at the end of the day rather than during the day. That is true. However, it is only by analysing such price actions can we develop our own approaches to identifying support resistance levels in future trading days.

The other interesting point is that this whole analysis is solely dependent on the day's price action, no fancy indicators needed, only requirements are patience and interest in listening to the message of the market for that day.

What about tomorrow?

Well, again watch out for the opening price and look at the price action to gauge whether the market is accepting the opening price as the fair value or not.

Wherever it opens, if it moves above 4555 and continues to stay above 4555, we can go long with initial SL at 4500. Use trailing SL to protect gains.

Wherever it opens, if it trades below 4490, we can short there with SL at 4535, and target 4450.

The price in the range of 4550 and 4490 is a kind of oscillating zone. I shall try to resist temptation to trade while the price is in this range.

We will know by the end of tomorrow how things pan out, won't we?


Disclaimer:
The above analysis is just that - my analysis. If you choose to trade on the basis of this analysis, you will be solely responsible for the outcome of the trade - profit or loss. Please keep in mind that day trading is not for the novice and there is significant risk of loss of capital in trading.

Sunday, May 31, 2009

A Dangerous Temptation

Personally speaking, some days during day trading I have this incredible urge to make a trade in the opposite direction of the trend. The thinking ( or the emotion) behind this goes like this: The market has gone up say 150 points already; how much higher can it go? So, you short the market with a very tight stop loss ( very tight because your know that if the highest point is taken out, it can go much higher). Alas, your stock loss is hit, but the market does not go zooming higher immediately, and it retraces a bit. So you think that your decision to short was right but the timing was a bit early. So you do it again. And again the trade is a loss!


Here are the actual trades - ALL SHORT sales - from May 29 ( taking into account 3pts for commission per trade) :

Bought
Sold
Profit Loss
4453.9 4449.1

(8)
4481.85 4477

(8)
4489 4485.5

(6)
4483.35 4484.1

(2)
4467.4 4481.1
11


Notice the last trade was profitable. And it had the potential to make more money. But I closed it a bit early. Why? Because I was afraid to lose money again after four losses.

Actually, I estimate that the probability of profits from such trades ( going against a main trend ) is perhaps 1 in 20. In other words, you can lose 190 points in 19 trades ( assume that average loss is 10 points)., and you gain may be 50 points in ONE winning trade. Net loss 140 points!!!!

What is the moral? Trading against a major trend is dangerous. It is very tempting, but the temptation is likely to lead to heavy loss on that day.