Trading the Market: Methods in Madness
Showing posts with label support and resistance. Show all posts

Sunday, October 25, 2009

Bangalore CNBC TV18 Investor's Camp - 24 Oct 2009

I attended the Bangalore meet on Saturday. This is the first time I participated in such an event.

There were four speakers.
Here are my personal take aways.

The first speaker was Sudarshan Sukhani. He was at his usual best. His statement about the market movement in the immediate future is that since the trend has been up, we must trade in that direction and there is not much use speculating where the top would be. When the trend reverses as it surely will, we should be prepared to trade in the other direction.

He presented several techniques on "Buying on Dips". He distinguished between two situations,

1. The first one was when the market in a sideways rangebound movement in an overall uptrend. The appropriate indicators are Bollinger Bands, Kelter Channels, CCI-100, EMA-50 and idea is to wait for the price to touch the lower ( or middle as appropriate) bands.

2. The other situation is when a strong uptrend has resumed, In such cases, the price may not dip to the lower bands mentioned above and the appropriat3e indicators would be Triangle formation, NR7, or Wedge patterns. The idea is to wait for such patterns to happend after resumptions of a trend and then trade in the direction of the trend.

For me, the presentation answered a long standing question as to which dip indicator is suitable for which occassion. The clarity of this presentation was just amazing.

I would summarize the other speakers in future posts.

If you have any comments please write to me at stockmarket.methods.in.madness@gmail.com

Like this post? You can receive it free by subscribing. Just click on this link


Disclaimer: The above analysis is just that - my analysis. If you choose to trade on the basis of this analysis, you will be solely responsible for the outcome of the trade - profit or loss. Please keep in mind that trading and in particular day trading is not for the novice and there is significant risk of loss of capital in trading

Thursday, October 8, 2009

Nifty Trading - Sellers Vs. Buyers

The market has once again started moving within a range. It went down to 4920 and then came up. It went up to 5080 and then came down.

Why is it moving up and down like that? I do not know the answer but I would like to reinterpret these movements in terms of classic tug of war between buyers and sellers.

Price fell from 5080 simply because MORE SELLERS EMERGED at that level than there were buyers.

Price recovered from 4920 because MORE BUYERS EMERGED at that level than there were sellers.

You might think that this is stating an obvious fact - but it has the advantage of helping you plan your trades.

For example, if 4920 were to break in the next few days, then you can take a bet on sellers having beaten the buyers and can go short at that point with a judicious SL

On the other hand if 5080 were to break on the upside, the buyers have won and you know what to do.

Until a winner emerges, it is not safe to take a huge bet on who is going to win. In other words, best to avoid trading in the range ( or trade in small volumes ) and trade in the direction when the breaking out /breaking down happens.

Until then cheer on from the sidelines.

If you have any comments please write to me at stockmarket.methods.in.madness@gmail.com

Like this post? You can receive it free by subscribing. Just click on this link


Disclaimer: The above analysis is just that - my analysis. If you choose to trade on the basis of this analysis, you will be solely responsible for the outcome of the trade - profit or loss. Please keep in mind that trading and in particular day trading is not for the novice and there is significant risk of loss of capital in trading

Monday, September 7, 2009

Nifty Trading .. 4700 resistance breaking, breaking, ...BROKEN!!

Finally, it seems, that the wait is over. The resistance band of 4600-4700 seems to have been decidedly broken.

Readers of this blog must have noticed that I have been skeptical about the upmove - my thinking was that I could not see what reason could there be for the market to go through 4700.

But the market has spoken. It has broken through 4700, Regardless of the reasons why it should not cross 4700 -- NSE PE is at 22, not cheap - or the reasons why it should go above 4700 - lot of cash on the side line - the price action is that the 4700-4750 has been broken through. It will be confirmed if on the next pull back the last swing low 4570 holds and we should all keep that in mind.

As traders, we must follow the market. So, either enter now or at the first pull back ( keep in mind that the pull back could be very short!!).

For investor, however the challenges are somewhat different. One challenge is not to chase price but wait patiently for a pullback, the other challenge is to preserve capital when the pendulum swings too far - the best way to do that is through asset allocation. Rebalacning asset allocation is an absolute must as we head into somewhat uncharted territory.


If you have any comments please write to me at stockmarket.methods.in.madness@gmail.com

Like this post? You can receive it free by subscribing. Just click on this link


Disclaimer: The above analysis is just that - my analysis. If you choose to trade on the basis of this analysis, you will be solely responsible for the outcome of the trade - profit or loss. Please keep in mind that trading and in particular day trading is not for the novice and there is significant risk of loss of capital in trading

Thursday, July 30, 2009

Nifty Trading - Range bound ... For how long?

Whichever way you look at it, whether it is the daily chart or the weekly chart, Nifty has been trading in a 15% range (4000-4600) since the big gap up post election.

Thrice it has tried to breakdown below 4200/4100/4000 and thrice it bounced back - the last time it bounced back it made a fool of people - including me - who had discovered the head and shoulder and thought that the market was about to go down and close the gap.

On the upside it tried to take out 4700 and failed; again in the last week and this week it is trying to breakthrough 4600, and right now it is faltering a bit ( who knows what will happens today and tomorrow and next week ..... ).

Clearly, one possibility is that it will breakout above 4700.

The other possibility is that it will be range bound between 4000-4600 for another 10 weeks!!!
now, why did I pick up that number 10 weeks?

If you look at the weekly chart, you can see that Nifty - after the break down in October 2008 - entered in a range of 2500 and 3100 on a closing basis for 23 weeks!!!! Of course in percentage terms that was a bigger range of about 20% but that was also because of the low base effect. In other words, it will not be unusual for Nifty to be range bound for another 10 weeks (since it has already spent 10 weeks in this range).


Now, people like excitement - for many of them range bound movement is boring and worse still, it catches them off guard apart from tasting their patience. Just when they think the market is going to break out or break down, the market reverses and reenters the range!!!

So lets recap the two possibilities.

1. Break out above 4700. You know what to do. Buy on dips with SL at 4500 perhaps , if you are trading on a weekly basis.

2. Range bound movements - here you sell at the upper end 4600-3700 and buy at the lower end 4000/4100 with SL above and below. It may be boring but then you have to decide whether you want to be entertained by the market or you want to earn money.


If you have any comments please write to me at stockmarket.methods.in.madness@gmail.com

Like this post? You can receive it free by subscribing. Just click on this link


Disclaimer: The above analysis is just that - my analysis. If you choose to trade on the basis of this analysis, you will be solely responsible for the outcome of the trade - profit or loss. Please keep in mind that trading and in particular day trading is not for the novice and there is significant risk of loss of capital in trading

Tuesday, July 14, 2009

Pre-Market Opening thoughts - Trading Nifty- 14 Jul 2009

Dow Jones last night made an impressive recovery - I have no idea why, nor do I need to know - suffice it to to say that in one day's action it has recovered what it had lost in last four days - in my book, that is impressive whether this reverses a down trend or not.

The last five days of Nifty also shows that it had lost ground in four out of those five day.

SGX nifty is trading +50 points - hovering just around 4020/4030 which was the highest level on Friday before Nifty suddenly gave way.

It seems therefore that we may have a uptrending day - the problem with my statement is that almost everyone may be thinking the same - where is the edge then?

At any rate, it might be prudent not to short today ( not until we reach somewhere near 4220) and perhaps go long with a Nifty spot SL at 3920 which was the lowest point yesterday.

If it turns out to be a volatile day as well, trailing SL may not work, in which case book profit when your target is reached . What could be a good target? For day traders, a target that gives them silghtly above their average profit per trade might be a good target.


If you have any comments please write to me at stockmarket.methods.in.madness@gmail.com

Like this post? You can receive it free by subscribing. Just click on this link


Disclaimer: The above analysis is just that - my analysis. If you choose to trade on the basis of this analysis, you will be solely responsible for the outcome of the trade - profit or loss. Please keep in mind that trading and in particular day trading is not for the novice and there is significant risk of loss of capital in trading.

Monday, July 13, 2009

Nifty Trading - Lesson from the Market - Friday 10 July 2009

Last week, I have been less regular in writing this blog than I wanted or intended to as I was traveling and visiting my parents. It was great taking a break and be with family.

In the mean while, .....

The market provided a fascinating instance of learning on Friday 10th July 2009.

Look at the five day chart.

Can you see

1. how for almost two days nifty moved in a very tight range?

2. how it broke out once one on the upside, and lastly,

3. how the false breakout reversed with great ferocity and broke through 4000?

I do not know about you, but here are the lessons for me:

1. Be patient - if you can detect a tight range - use that info either not to trade until a break out happens OR trade with low volume and increase volume after break out.

2. EQUALLY importantly, be prepared for a false breakout ( especially if it is against the prevailing trend) . Prepared but HOW? By keeping a Stop Loss. On Friday, those who traded long late in the afternoon and forgot to put a SL , hoping that 4050 will hold must have learned this lesson the hard way.

3. There is no sure thing in trading. Be prepared and have SL.

More on these themes and other stock specific ideas later in the week.

Sunday, June 28, 2009

Nifty Day Trading vs. Investing - What vs. Why

At the outset let me state that I do both - I have a portfolio of investment which I do not touch for day trading. I also day trade Nifty futures. AND I keep these two activities separate.

However, since I am involved in both, I become aware of differences in the approaches and in the types of questions that are asked in each endeavor.

In this post, I will focus on the types of questions that a day trader - hopefully a successful day trader - focuses on.

Short term trading is all about focusing on and analysing the prevailing price action - the shorter the term, the sharper is the focus - and day trading is nothing but price action of the minute, hour or the day.

An investor asks the question: why is the price falling?

A day trader does not ask that question. To her, that the price is falling is a reality.
At the most she might ask:

What has the price fallen to? Or, more importantly,

What was the last swing high? Or,

What are the support or resistance levels, as seen in the price action?


Whereas an investor will ask why is the p/e so high? and might decide to buy or sell based on answers to such questions, a day trader will never ask ( or must never ask ) why the last support broken or why did the last resistance did not hold? Instead, the trader accepts the reality, absorbs a loss if found wrong, and sets up the next trade.

The focus of a trader is what is happening rather that why it is happening.

I would love to hear your thoughts on this topic. If you have any comments please write to me at stockmarket.methods.in.madness@gmail.com

Like this post? You can receive it free by subscribing. Just click on this link


Disclaimer: The above analysis is just that - my analysis. If you choose to trade on the basis of this analysis, you will be solely responsible for the outcome of the trade - profit or loss. Please keep in mind that trading and in particular day trading is not for the novice and there is significant risk of loss of capital in trading.

Friday, June 26, 2009

Nifty Trading - To Trade or Not to Trade - That is the question

One of the most important things to learn in trading - particularly in day trading - is when not to trade.

I feel that for quite an extended period of time yesterday - roughly from 11.30 am to 1.30 pm - it was important to stay away, unless you are extremely good in scratch trades -- meaning you are good in getting in and out of trades - which is not my style.


Lets analyse the situation in a little more detail.

The day started on a positive note, all the 3 min, 13 min, 34 min EMAs were nicely arranged and moving up.

The first danger signal came around 11 - 11.15 am. Nifty failed to move up and cross beyond 4320, below the day's high of 4338. What this meant was that a potential resistance level was established at 4320 by 11.15 am.

And the late/mid morning session continued like that. Just when it appeared Nifty was heading south, it turned back having found support at 4285.

Now, why are we spending so much time on this? Because the chance of over trading is much higher in these situations and over trading typically accumulates many small losses, resulting in a net big loss.

Coming back to the price action, depending on which Moving Average Crossover system you use, chances are that several of them may have given false signals either long or short between 11.15 am and 1.30 pm.

The best way I know of avoiding this is to pay attention to the price action realities and not project which way it was going to go. In other words, accept 4285 and 4320 as support and resistance and wait for them to be broken rather than anticipating a breakdown or a breakout.

And equally important - do not trade between the support and resistance when the range is so short.

The market is cruel to impatient traders and rewards the patient traders. In this regard at least, investors and traders have something in common - they both need to be patient in the context of their respective trading time scales.

If you have any comments please write to me at stockmarket.methods.in.madness@gmail.com

Like this post? You can receive it free by subscribing. Just click on this link


Disclaimer: The above analysis is just that - my analysis. If you choose to trade on the basis of this analysis, you will be solely responsible for the outcome of the trade - profit or loss. Please keep in mind that trading and in particular day trading is not for the novice and there is significant risk of loss of capital in trading.

Wednesday, June 24, 2009

Support Levels - Universal or Personal?

For sometime now, I have believed 4200 Nifty was an important support level and its breakdown will take the Nifty down much further.

There were others who believed that 4160, 4140, 4100 were the levels to watch for support.

In yesterday's trading, the market frowned on me and smiled on the second group - meaning 4200 broke but the market reversed from around 4140.

This brings us to the important question: which support level should one believe in?

Here is the answer that surprises a lot of new traders. There is no single unique mathematical number that can be calculated by everyone and described as support.

One of my revered mentors, Sudarshan Sukhani, - from whose writings I have learned a lot - has put it beautifully in his blog posting when he says "all said and done, support and resistance levels are personal numbers, used to determine risk. We can have different levels and trade successfully". You can read his posting here.

I would like to add that any support level breakdown is again a probabilistic event - the very fact that it is being called a breakdown means that it is a high probability event , BUT of course once in a while it will be a false breakdown or a breakdown that will see a whipsaw before going down again.

What is therefore important is to develop your own approach to determine support levels and do that consistently - without regard to others levels - this consistency is single most important thing in ensuring that over many trades you will come out with more money ( not necessarily with more number of winning trades) from your winners over your losers.

For myself, I had a bad bad day on Tuesday. On Monday I ended holding a long thinking that 4200 will hold. Of course it did not hold and Tuesday morning first thing I did was to exit that trade and went short at 4180 with SL at 4215. Of course I suffered a loss AGAIN, but then it finally dawned on me that 4160 AND 421O were acting as support and resistance for that part of the day. I successfully used these facts to finally end the day with negative -37 as opposed to -79 the situation I was in after the second trade.

Again for myself, I accept that Nifty has found support at 4140 - accepting that means I will not go short around 4200 any more until that4140 level or even 4100 level is broken. I may choose to go long now or not depending on my reading of the market - remember that for day trading, you have to read the market during the day!!

If you have any comments please write to me at stockmarket.methods.in.madness@gmail.com

Like this post? You can receive it free by subscribing. Just click on this link


Disclaimer: The above analysis is just that - my analysis. If you choose to trade on the basis of this analysis, you will be solely responsible for the outcome of the trade - profit or loss. Please keep in mind that trading and in particular day trading is not for the novice and there is significant risk of loss of capital in trading.

Wednesday, June 17, 2009

Support and Resistance in Day Trading - View on 17 Jun 2009

I was away for three days - almost three life times in day trading.

After a quick look at the nifty charts over the few days and also keeping in mind the US market action yesterday, here is my trading strategy:

Trade with a negative bias.

In particular, if the market opens slightly higher than 4520 ( say 4550) - make an operating assumption that 4600 will be a significant resistance level. Why 4600 as a resistance level?

Look at the 5D chart which shows that 4600 was a support last Thursday and broke down on Friday. So it is relatively safe to assume 4600 as a good resistance.

With this assumption you can short closer to 4600 ( in the 4560-4580 level) with SL at 4615. If SL is hit, I would refrain from trading short or long and wait to see if there is a new resistance level. Of course for another breakout to happen 4710 has to be crossed.

If the market opens lower, I would wait 4480 to be broken decisively before shorting. Yesterday's high 4540 will be a good SL.

Lots of options. The trick is to pick one strategy. If that works for the day, good. If not, study the market action and try to understand what the message is before putting in a trade!!!

If you have any comments please write to me at stockmarket.methods.in.madness@gmail.com

Disclaimer: The above analysis is just that - my analysis. If you choose to trade on the basis of this analysis, you will be solely responsible for the outcome of the trade - profit or loss. Please keep in mind that trading and in particular day trading is not for the novice and there is significant risk of loss of capital in trading.

Friday, June 12, 2009

A Perfect Day for Oscillators

Yesterday, I had mentioned that Nifty 4530 would be an important level. Sometimes the market is nice to you and allows you to be correct. Indeed, today the market pivoted around 4530/4540.


Such days are fantastic for oscillators. Look at the slow stochastic chart. If you bought and sold as the stochastic came out of oversold and overbought regions, you would have made a resonable amount of Nifty points in trading today. I have not checked with other oscillators though.

If you have any comments please write to me at stockmarket.methods.in.madness@gmail.com

Disclaimer: The above analysis is just that - my analysis. If you choose to trade on the basis of this analysis, you will be solely responsible for the outcome of the trade - profit or loss. Please keep in mind that trading and in particular day trading is not for the novice and there is significant risk of loss of capital in trading.

Wednesday, June 10, 2009

Another Breakout, But ......

The market had another breakout today. All seems to be well, except that the advance / decline ratio for all nse stocks actually reversed in the final hour ( meaning it had more declining stocks than advancing ones).

This could be a cause for worry.

One more observation. Nifty future had a double bottom at 4630/4635. The pivot points for Nifty for tomorrow are PP: 4632. Thus 4630 (Nifty) may turn out to be an important level tomorrow. The S1 and R1 are at 4575 and 4712. You can develop a strategy around the 4630 but do keep tight stop loss and do not fight the market, in case your strategy turns out to be out of favour with the market price action.

If you have any comments please write to me at stockmarket.methods.in.madness@gmail.com

Disclaimer: The above analysis is just that - my analysis. If you choose to trade on the basis of this analysis, you will be solely responsible for the outcome of the trade - profit or loss. Please keep in mind that trading and in particular day trading is not for the novice and there is significant risk of loss of capital in trading.

Thursday, June 4, 2009

Analyzing actual Trades - 04 Jun 2009

This morning, I said

Quote

For Traders with a SHORT TERM BEARISH VIEW OF THE MARKET

Go short if Nifty trades below 4470, SL at 4530 or 4575 depending on your risk appetite and position sizing


For Traders with a SHORT TERM BULLISH VIEW OF THE MARKET

Go long around 4490 ( nifty ) with SL 4430. If 4430 breaks, stay away until a dip is clearly visible

Unquote


As it turned out, the first group of traders would have perhaps broken even with a bit of tight management of SL , while the second group would have made a good amount of money.

For myself, I chose to trade with a negative bias, and was a bit more aggressive than I had suggested. Also, for me preservation of capital is of great importance. Hence I try to break even as soon as possible. Here were my actual trades from today.


First Trade:

Time: 10.08 am: Sell Short at 4494.25, Initial ( Mental ) Stop Loss @ 4540
Time: 10.24 am: Nifty at 4484, placed Actual Stop Loss @4512
Time: 10.39 am: Nifty at 4472, moved Stop Loss to 4591 (BREAK EVEN after commission, YES!)
Time: 11.00 am: SL triggered.
No gain no Loss on this trade.

Second Trade: ( still staying with Negative bias )

Time: 11.14 am: Sell Short at 4487 Initial (Mental) Stop Loss @4512
Time: 11.17 am: Nifty at 4493, placed Actual Stop Loss at 4504
Time: 11.27 am: Nifty at 4475, moved Stop Loss to 4485 ( In the Positive , YES!)
Time: 11.36 am: Nifty at 4463, moved Stop Loss to 4474
Time: 11.45 am: Nifty at 4457, REALIZED STRONG RESISTANCE at 4450, moved Stop Loss to 4563
Time: 11.47 am: Stop Loss triggered
Net Gain - 20 points after commission

What happened during the rest of the day? Watched the market recover ground, realized my negative bias is not supported by price action, chose not to participate.

What is the moral? If you have a reasonable strategy, and you stick to it, you have a reasonable chance of getting somewhere even if you misread the market.

Disclaimer: The above analysis is just that - my analysis. If you choose to trade on the basis of this analysis, you will be solely responsible for the outcome of the trade - profit or loss. Please keep in mind that day trading is not for the novice and there is significant risk of loss of capital in trading.

Pre-Market Opening thoughts - 04 Jun 2009

It is now 9.50 am. India Time

SGX Nifty bid / ask are 4490/4495.

For short term trading, this is a key level.

For Traders with a SHORT TERM BEARISH VIEW OF THE MARKET

Go short if Nifty trades below 4470, SL at 4530 or 4575 depending on your risk appetite and position sizing


For Traders with a SHORT TERM BULLISH VIEW OF THE MARKET

Go long around 4490 ( nifty ) with SL 4430. If 4430 breaks, stay away until a dip is clearly visible.


Disclaimer: The above analysis is just that - my analysis. If you choose to trade on the basis of this analysis, you will be solely responsible for the outcome of the trade - profit or loss. Please keep in mind that day trading is not for the novice and there is significant risk of loss of capital in trading.

Tuesday, June 2, 2009

Traders must buy of dips... What is a dip?

This is a very important question. No doubt that traders must buy on dips since the trend is up. But how do we know when the dip happens, and what should be the stop loss?

I leave the reader with this important question and with a hint: Whether it is a dip or not will depend on the time frame of your trading strategy.


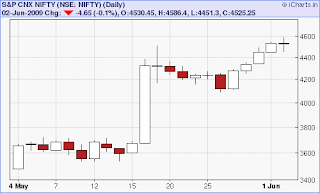
Look at the one month chart for Nifty. There seems to be a dip in May 26. should you have bought then and what should be the stop loss?

I shall share my thoughts on this in my next posting.

Forecast for June 2 came through

In yesterday's post, I had suggested to go short if nifty fell below 4490:

"Wherever it opens, if it trades below 4490, we can short there with SL at 4535, and target 4450."

I am fortunate that the market obliged and at least part of the market action went that way.

I do not mean to suggest that I have a magic formula which will ensure correctness of my forecast all the time - I will be lucky if I get it right 35-40% and the time. The other times I am wrong, I must manage the stop loss in such a way that my overall profit ( 35% of the time ) is more than the losses for the rest of the trades ( 65% of the time).

That is the name of the game - the game of probability - and these are the methods in seeming market madness.

I do not have a forecast for tomorrow as I am not well today. Wish you the best in tomorrow's trading.

Disclaimer: The above analysis is just that - my analysis. If you choose to trade on the basis of this analysis, you will be solely responsible for the outcome of the trade - profit or loss. Please keep in mind that day trading is not for the novice and there is significant risk of loss of capital in trading.

Monday, June 1, 2009

An Examination of Today's Nifty - 01 June 2009

Before we discuss today's nifty price movements, let us start with a very important topic, namely, relevance of the opening price in day's trading.

Here I can do no better than quoting from Brett Steenbarger's recent blog post on 21 May 2009. Here is the opening paragraph:

"
The opening price .... represents the market's first attempt at locating value on the day. A trending market will stay above or below the opening price for the majority of the session, as we reject that early estimate and probe value higher or lower. A bracketing or range market will tend to accept the early estimate of value, and we will oscillate around the open and/or the day's volume-weighted average price for much of the session.
"

Coming back to today's trade, it opened higher and within half an hour raced towards 4545 which it reached at 10.22 am. Now the index had gone up so much in the last two days, so the question was, is it going to be another tear away day, or will it be range bound and will the market accept the market opening as a fair value?

Such questions can only be resolved by waiting for the day to unfold. As it happened, by 11 am it was obvious that 4545 was the day's tentative high and the market was falling from there. The prudent thing to do was to wait again and see if yesterday's closing held. It did. It reached 4476 at 11.22 and began to turn up.

Thus by 11.30 am, the market had established the day's high at 4545 and day's low at 4476. And the chance increased that it was going to be a range bound day.


Notice also that the market established another support level around 4495 which it visited thrice during the course of the day. By this time, it was a relatively safer bet to put in a long trade around Nifty 4500 with SL at 4476. In other words, we could treat 4500 as a support level with 4476 as the "get me out of here" kind of SL level got long trades.

One can argue that hindsight is 50-50 and it is easy to analyse these at the end of the day rather than during the day. That is true. However, it is only by analysing such price actions can we develop our own approaches to identifying support resistance levels in future trading days.

The other interesting point is that this whole analysis is solely dependent on the day's price action, no fancy indicators needed, only requirements are patience and interest in listening to the message of the market for that day.

What about tomorrow?

Well, again watch out for the opening price and look at the price action to gauge whether the market is accepting the opening price as the fair value or not.

Wherever it opens, if it moves above 4555 and continues to stay above 4555, we can go long with initial SL at 4500. Use trailing SL to protect gains.

Wherever it opens, if it trades below 4490, we can short there with SL at 4535, and target 4450.

The price in the range of 4550 and 4490 is a kind of oscillating zone. I shall try to resist temptation to trade while the price is in this range.

We will know by the end of tomorrow how things pan out, won't we?


Disclaimer:
The above analysis is just that - my analysis. If you choose to trade on the basis of this analysis, you will be solely responsible for the outcome of the trade - profit or loss. Please keep in mind that day trading is not for the novice and there is significant risk of loss of capital in trading.