Trading the Market: Methods in Madness
Showing posts with label techncial analysis. Show all posts

Thursday, July 16, 2009

Nifty Trading: Responding to a Request

Recently, I left a comment on Sudarshanji's blog and this morning one Mr./Ms. "MG" left me a message on my Live Chat - s/he left the message at 2 am Indian time, when I was not quite alive nor dead for sure, just sleeping soundly. The message is:

""
hello...., you wrote " I sure hope so - which is why I am so fond of 20 EMA waves!!!!" in sukhani's blog... can you please tell how to use 20 ema in trading

""

Before I respond to this request, it might be better if I briefly summarize the content of the Sudarshanji's post "Worries on the long term" and my comment. In essence, the issue was DOW Jones is at the same level NOW where it was in 1997. This is the result of reversion to the mean, and might also imply that Indian markets would remain range bound for many months or years having had a growth phase from 2004 to 2008. In my comment I suggested that positional trading would be one way to beat reversion to the mean phenomenon. You can read both the post and my comment here.

Now coming to the request, I can do no better than going back to the master Sudarshanji himself - the major source of my understanding of technical analysis. Please study and review many many times his amazing post Swing Trading Presentation - March 7, 2009 which clearly explains how to use WMA ( or EMA for that matter ) waves. I hope this will help the person who made the request.


If you have any comments please write to me at stockmarket.methods.in.madness@gmail.com

Like this post? You can receive it free by subscribing. Just click on this link


Disclaimer: The above analysis is just that - my analysis. If you choose to trade on the basis of this analysis, you will be solely responsible for the outcome of the trade - profit or loss. Please keep in mind that trading and in particular day trading is not for the novice and there is significant risk of loss of capital in trading.

Wednesday, June 17, 2009

Technical analysis works ( in a probablistic sense)

Earlier this morning I suggested trading with a negative bias. In fact, part of what I said was

"If the market opens lower, I would wait 4480 to be broken decisively before shorting. Yesterday's high 4540 will be a good SL"

The market broke 4480 early but then went up to 4520 almost. Second time when it broke 4480, it did not look back.

I do not want to say merely that technical analysis work - what is more relevant is to say that if you u use technical analysis AND trade with discipline, then you increase the odds in your favour to buy low and sell high OR sell high and buy low. In this case discipline meant selling below 4480 and keeping SL above 4540!

The day's action has opened the doors for positional traders. I will write about this in my next posting.

If you have any comments please write to me at stockmarket.methods.in.madness@gmail.com

Sunday, June 14, 2009

Stock Study of the Week - SBI - 14Jun2009

On weekends I spend sometime studying charts of the reputable companies - those that make up Sensex or Nify or BSE200 - either to detect near term price pattern or to seek dips and pullbacks.

This week I looked at the chart of SBI - certainly a reputable company!


As you can see, the last Friday closing price 1634 is below 1660 which is the 20 EMA ( Low). It seems that we can expect the stock to move down further in the next few weeks. Now this down turn will be arrested or over if if the stock were to close above its 20 EMA ( High) which is 1754 at this time.

In other words, aggressive traders can short SBI with a SL at 1754.

What about an investor who is waiting for a chance to buy SBI at lower price? S/he can also make use of this analysis and wait for a lower price to be reached. What target price should we look for in such a case?

Lets look at the chart again. The 50 day EMA ( Low) is located now at 1475. So we can reasonably set a target of 1475.

In other words, a trader can short SBI now with SL at 1754 and a target of 1475. And an investor wanting to accumulate SBI at a more reasonable valuation can plan to - not hope to - pick up SBI around 1475/1500 which is a good 135 points below the current price.

Does this analysis make sense to you?

If you have any comments please write to me at stockmarket.methods.in.madness@gmail.com

Disclaimer: The above analysis is just that - my analysis. If you choose to trade on the basis of this analysis, you will be solely responsible for the outcome of the trade - profit or loss. Please keep in mind that trading and in particular day trading is not for the novice and there is significant risk of loss of capital in trading.

Thursday, June 4, 2009

Pre-Market Opening thoughts - 04 Jun 2009

It is now 9.50 am. India Time

SGX Nifty bid / ask are 4490/4495.

For short term trading, this is a key level.

For Traders with a SHORT TERM BEARISH VIEW OF THE MARKET

Go short if Nifty trades below 4470, SL at 4530 or 4575 depending on your risk appetite and position sizing


For Traders with a SHORT TERM BULLISH VIEW OF THE MARKET

Go long around 4490 ( nifty ) with SL 4430. If 4430 breaks, stay away until a dip is clearly visible.


Disclaimer: The above analysis is just that - my analysis. If you choose to trade on the basis of this analysis, you will be solely responsible for the outcome of the trade - profit or loss. Please keep in mind that day trading is not for the novice and there is significant risk of loss of capital in trading.

Wednesday, June 3, 2009

How to identify a dip or a pullback?

Continuing with yesterday's topic, we need to understand the relevance of trading time scale in discussing dips.

For example, today 3rd Jun 2009, the nifty "dipped" to 4480. This is clearly an intraday dip relevant for day trading but may not be relevant for swing traders or positional traders.

A sudden fall is not a dip. It may be just one leg of consecutive falls. For a sequence of falls to become a dip, it is necessary that the price action starts heading back up. If you are a swing trader trading using EOD price indicators, then a good, working definition of a dip could well be a day which has higher prices for two days before AND two days after. This means if you use this definition of a dip, you cannot detect a dip right at its lowest point. You have to wait for two more days.

There is nothing sacred about the number two. You can have three or five in place of two. Of course the number of days you have before and after will also determine by much you miss the bottom of the dip. In my experience, 2, 3 days work well.

Another way to detect a dip and a pull back would be to use plots of Highs and Lows of the moving averages. If you plot Highs and Lows of 5 days exponential moving average for the last six months, you can see that there are wave patterns which allows you to identify a dip soon after it happens. This is the basic idea. You can choose another time frame to suit your own needs. But once you choose a time frame, stick to it.

Lastly, you must decide on stop loss and when to take profits. We will cover these in later posts.


Disclaimer: The above analysis is just that - my analysis. If you choose to trade on the basis of this analysis, you will be solely responsible for the outcome of the trade - profit or loss. Please keep in mind that day trading is not for the novice and there is significant risk of loss of capital in trading.

Tuesday, June 2, 2009

Traders must buy of dips... What is a dip?

This is a very important question. No doubt that traders must buy on dips since the trend is up. But how do we know when the dip happens, and what should be the stop loss?

I leave the reader with this important question and with a hint: Whether it is a dip or not will depend on the time frame of your trading strategy.


Look at the one month chart for Nifty. There seems to be a dip in May 26. should you have bought then and what should be the stop loss?

I shall share my thoughts on this in my next posting.

Forecast for June 2 came through

In yesterday's post, I had suggested to go short if nifty fell below 4490:

"Wherever it opens, if it trades below 4490, we can short there with SL at 4535, and target 4450."

I am fortunate that the market obliged and at least part of the market action went that way.

I do not mean to suggest that I have a magic formula which will ensure correctness of my forecast all the time - I will be lucky if I get it right 35-40% and the time. The other times I am wrong, I must manage the stop loss in such a way that my overall profit ( 35% of the time ) is more than the losses for the rest of the trades ( 65% of the time).

That is the name of the game - the game of probability - and these are the methods in seeming market madness.

I do not have a forecast for tomorrow as I am not well today. Wish you the best in tomorrow's trading.

Disclaimer: The above analysis is just that - my analysis. If you choose to trade on the basis of this analysis, you will be solely responsible for the outcome of the trade - profit or loss. Please keep in mind that day trading is not for the novice and there is significant risk of loss of capital in trading.

Monday, June 1, 2009

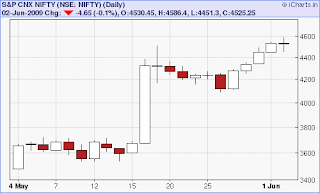
An Examination of Today's Nifty - 01 June 2009

Before we discuss today's nifty price movements, let us start with a very important topic, namely, relevance of the opening price in day's trading.

Here I can do no better than quoting from Brett Steenbarger's recent blog post on 21 May 2009. Here is the opening paragraph:

"
The opening price .... represents the market's first attempt at locating value on the day. A trending market will stay above or below the opening price for the majority of the session, as we reject that early estimate and probe value higher or lower. A bracketing or range market will tend to accept the early estimate of value, and we will oscillate around the open and/or the day's volume-weighted average price for much of the session.
"

Coming back to today's trade, it opened higher and within half an hour raced towards 4545 which it reached at 10.22 am. Now the index had gone up so much in the last two days, so the question was, is it going to be another tear away day, or will it be range bound and will the market accept the market opening as a fair value?

Such questions can only be resolved by waiting for the day to unfold. As it happened, by 11 am it was obvious that 4545 was the day's tentative high and the market was falling from there. The prudent thing to do was to wait again and see if yesterday's closing held. It did. It reached 4476 at 11.22 and began to turn up.

Thus by 11.30 am, the market had established the day's high at 4545 and day's low at 4476. And the chance increased that it was going to be a range bound day.


Notice also that the market established another support level around 4495 which it visited thrice during the course of the day. By this time, it was a relatively safer bet to put in a long trade around Nifty 4500 with SL at 4476. In other words, we could treat 4500 as a support level with 4476 as the "get me out of here" kind of SL level got long trades.

One can argue that hindsight is 50-50 and it is easy to analyse these at the end of the day rather than during the day. That is true. However, it is only by analysing such price actions can we develop our own approaches to identifying support resistance levels in future trading days.

The other interesting point is that this whole analysis is solely dependent on the day's price action, no fancy indicators needed, only requirements are patience and interest in listening to the message of the market for that day.

What about tomorrow?

Well, again watch out for the opening price and look at the price action to gauge whether the market is accepting the opening price as the fair value or not.

Wherever it opens, if it moves above 4555 and continues to stay above 4555, we can go long with initial SL at 4500. Use trailing SL to protect gains.

Wherever it opens, if it trades below 4490, we can short there with SL at 4535, and target 4450.

The price in the range of 4550 and 4490 is a kind of oscillating zone. I shall try to resist temptation to trade while the price is in this range.

We will know by the end of tomorrow how things pan out, won't we?


Disclaimer:
The above analysis is just that - my analysis. If you choose to trade on the basis of this analysis, you will be solely responsible for the outcome of the trade - profit or loss. Please keep in mind that day trading is not for the novice and there is significant risk of loss of capital in trading.

Sunday, May 31, 2009

Bharti - A Technical Look - 31 May 2009

The week that has just gone by saw a lot of news flow regarding Bharti Enterprises - particularly the renewed Bharti MTN deal. Many analysts - the fundamental analysts in particular - were preoccupied with unraveling many complex aspects of the deal such as the the financial aspect, the regulatory aspect etc.

Let us instead look at the daily price action. See the chart of Bharti (you can click on the chart to get a larger view which will be shown in a new window) . Since the news broke, the market reacted negatively for three days, and then pulled itself up in the next two days ( these two days were also days when the market went up a lot). Now the thing to notice is that the script has bounced off its support at 750 and is now poised to break through the green rectangle.

It is clear that the trend has been up. So, we accept that the trend is up and treat the most recent price action as a correction. Therefore we should look and get ready for a buy set up. This view is supported by the slow stochastic about to come out above 20 and the RSI beginning to stay above 50. Here are some specific suggestions:


1. For Aggressive traders: buy between 820 and 750, with SL at 720.

2. For Traders with moderate risk appetite: buy when Bharti closes above 875 on a daily closing basis. SL at 750.

Once the trade is taken, trailing stop loss should be employed to protect gains if and when the trade becomes profitable.