Trading the Market: Methods in Madness
Showing posts with label swing trading. Show all posts

Thursday, July 16, 2009

Nifty Trading: Responding to a Request

Recently, I left a comment on Sudarshanji's blog and this morning one Mr./Ms. "MG" left me a message on my Live Chat - s/he left the message at 2 am Indian time, when I was not quite alive nor dead for sure, just sleeping soundly. The message is:

""
hello...., you wrote " I sure hope so - which is why I am so fond of 20 EMA waves!!!!" in sukhani's blog... can you please tell how to use 20 ema in trading

""

Before I respond to this request, it might be better if I briefly summarize the content of the Sudarshanji's post "Worries on the long term" and my comment. In essence, the issue was DOW Jones is at the same level NOW where it was in 1997. This is the result of reversion to the mean, and might also imply that Indian markets would remain range bound for many months or years having had a growth phase from 2004 to 2008. In my comment I suggested that positional trading would be one way to beat reversion to the mean phenomenon. You can read both the post and my comment here.

Now coming to the request, I can do no better than going back to the master Sudarshanji himself - the major source of my understanding of technical analysis. Please study and review many many times his amazing post Swing Trading Presentation - March 7, 2009 which clearly explains how to use WMA ( or EMA for that matter ) waves. I hope this will help the person who made the request.


If you have any comments please write to me at stockmarket.methods.in.madness@gmail.com

Like this post? You can receive it free by subscribing. Just click on this link


Disclaimer: The above analysis is just that - my analysis. If you choose to trade on the basis of this analysis, you will be solely responsible for the outcome of the trade - profit or loss. Please keep in mind that trading and in particular day trading is not for the novice and there is significant risk of loss of capital in trading.

Wednesday, June 3, 2009

How to identify a dip or a pullback?

Continuing with yesterday's topic, we need to understand the relevance of trading time scale in discussing dips.

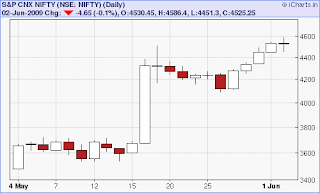
For example, today 3rd Jun 2009, the nifty "dipped" to 4480. This is clearly an intraday dip relevant for day trading but may not be relevant for swing traders or positional traders.

A sudden fall is not a dip. It may be just one leg of consecutive falls. For a sequence of falls to become a dip, it is necessary that the price action starts heading back up. If you are a swing trader trading using EOD price indicators, then a good, working definition of a dip could well be a day which has higher prices for two days before AND two days after. This means if you use this definition of a dip, you cannot detect a dip right at its lowest point. You have to wait for two more days.

There is nothing sacred about the number two. You can have three or five in place of two. Of course the number of days you have before and after will also determine by much you miss the bottom of the dip. In my experience, 2, 3 days work well.

Another way to detect a dip and a pull back would be to use plots of Highs and Lows of the moving averages. If you plot Highs and Lows of 5 days exponential moving average for the last six months, you can see that there are wave patterns which allows you to identify a dip soon after it happens. This is the basic idea. You can choose another time frame to suit your own needs. But once you choose a time frame, stick to it.

Lastly, you must decide on stop loss and when to take profits. We will cover these in later posts.


Disclaimer: The above analysis is just that - my analysis. If you choose to trade on the basis of this analysis, you will be solely responsible for the outcome of the trade - profit or loss. Please keep in mind that day trading is not for the novice and there is significant risk of loss of capital in trading.
Tuesday, June 2, 2009

Traders must buy of dips... What is a dip?

This is a very important question. No doubt that traders must buy on dips since the trend is up. But how do we know when the dip happens, and what should be the stop loss?

I leave the reader with this important question and with a hint: Whether it is a dip or not will depend on the time frame of your trading strategy.


Look at the one month chart for Nifty. There seems to be a dip in May 26. should you have bought then and what should be the stop loss?

I shall share my thoughts on this in my next posting.

Sunday, May 31, 2009

Bharti - A Technical Look - 31 May 2009

The week that has just gone by saw a lot of news flow regarding Bharti Enterprises - particularly the renewed Bharti MTN deal. Many analysts - the fundamental analysts in particular - were preoccupied with unraveling many complex aspects of the deal such as the the financial aspect, the regulatory aspect etc.

Let us instead look at the daily price action. See the chart of Bharti (you can click on the chart to get a larger view which will be shown in a new window) . Since the news broke, the market reacted negatively for three days, and then pulled itself up in the next two days ( these two days were also days when the market went up a lot). Now the thing to notice is that the script has bounced off its support at 750 and is now poised to break through the green rectangle.

It is clear that the trend has been up. So, we accept that the trend is up and treat the most recent price action as a correction. Therefore we should look and get ready for a buy set up. This view is supported by the slow stochastic about to come out above 20 and the RSI beginning to stay above 50. Here are some specific suggestions:


1. For Aggressive traders: buy between 820 and 750, with SL at 720.

2. For Traders with moderate risk appetite: buy when Bharti closes above 875 on a daily closing basis. SL at 750.

Once the trade is taken, trailing stop loss should be employed to protect gains if and when the trade becomes profitable.